Manhattan / Design research
Urban perception · Machine learningUrban Perceived
Speed
Exploring how urban form shapes unequal experiences of time, with human perception as a primary input for machine learning.
The brief
How does the city shape the pace we feel?
Urban Perceived Speed investigates the relationship between streetscape composition and perceived temporal speed across Manhattan.
Through pairwise surveys, image segmentation, and a random forest model, the project develops a pipeline in which human judgments guide what the model learns to recognize, opening a way to examine temporal inequality through urban form.
01 / Context
One city. Different experiences of time.
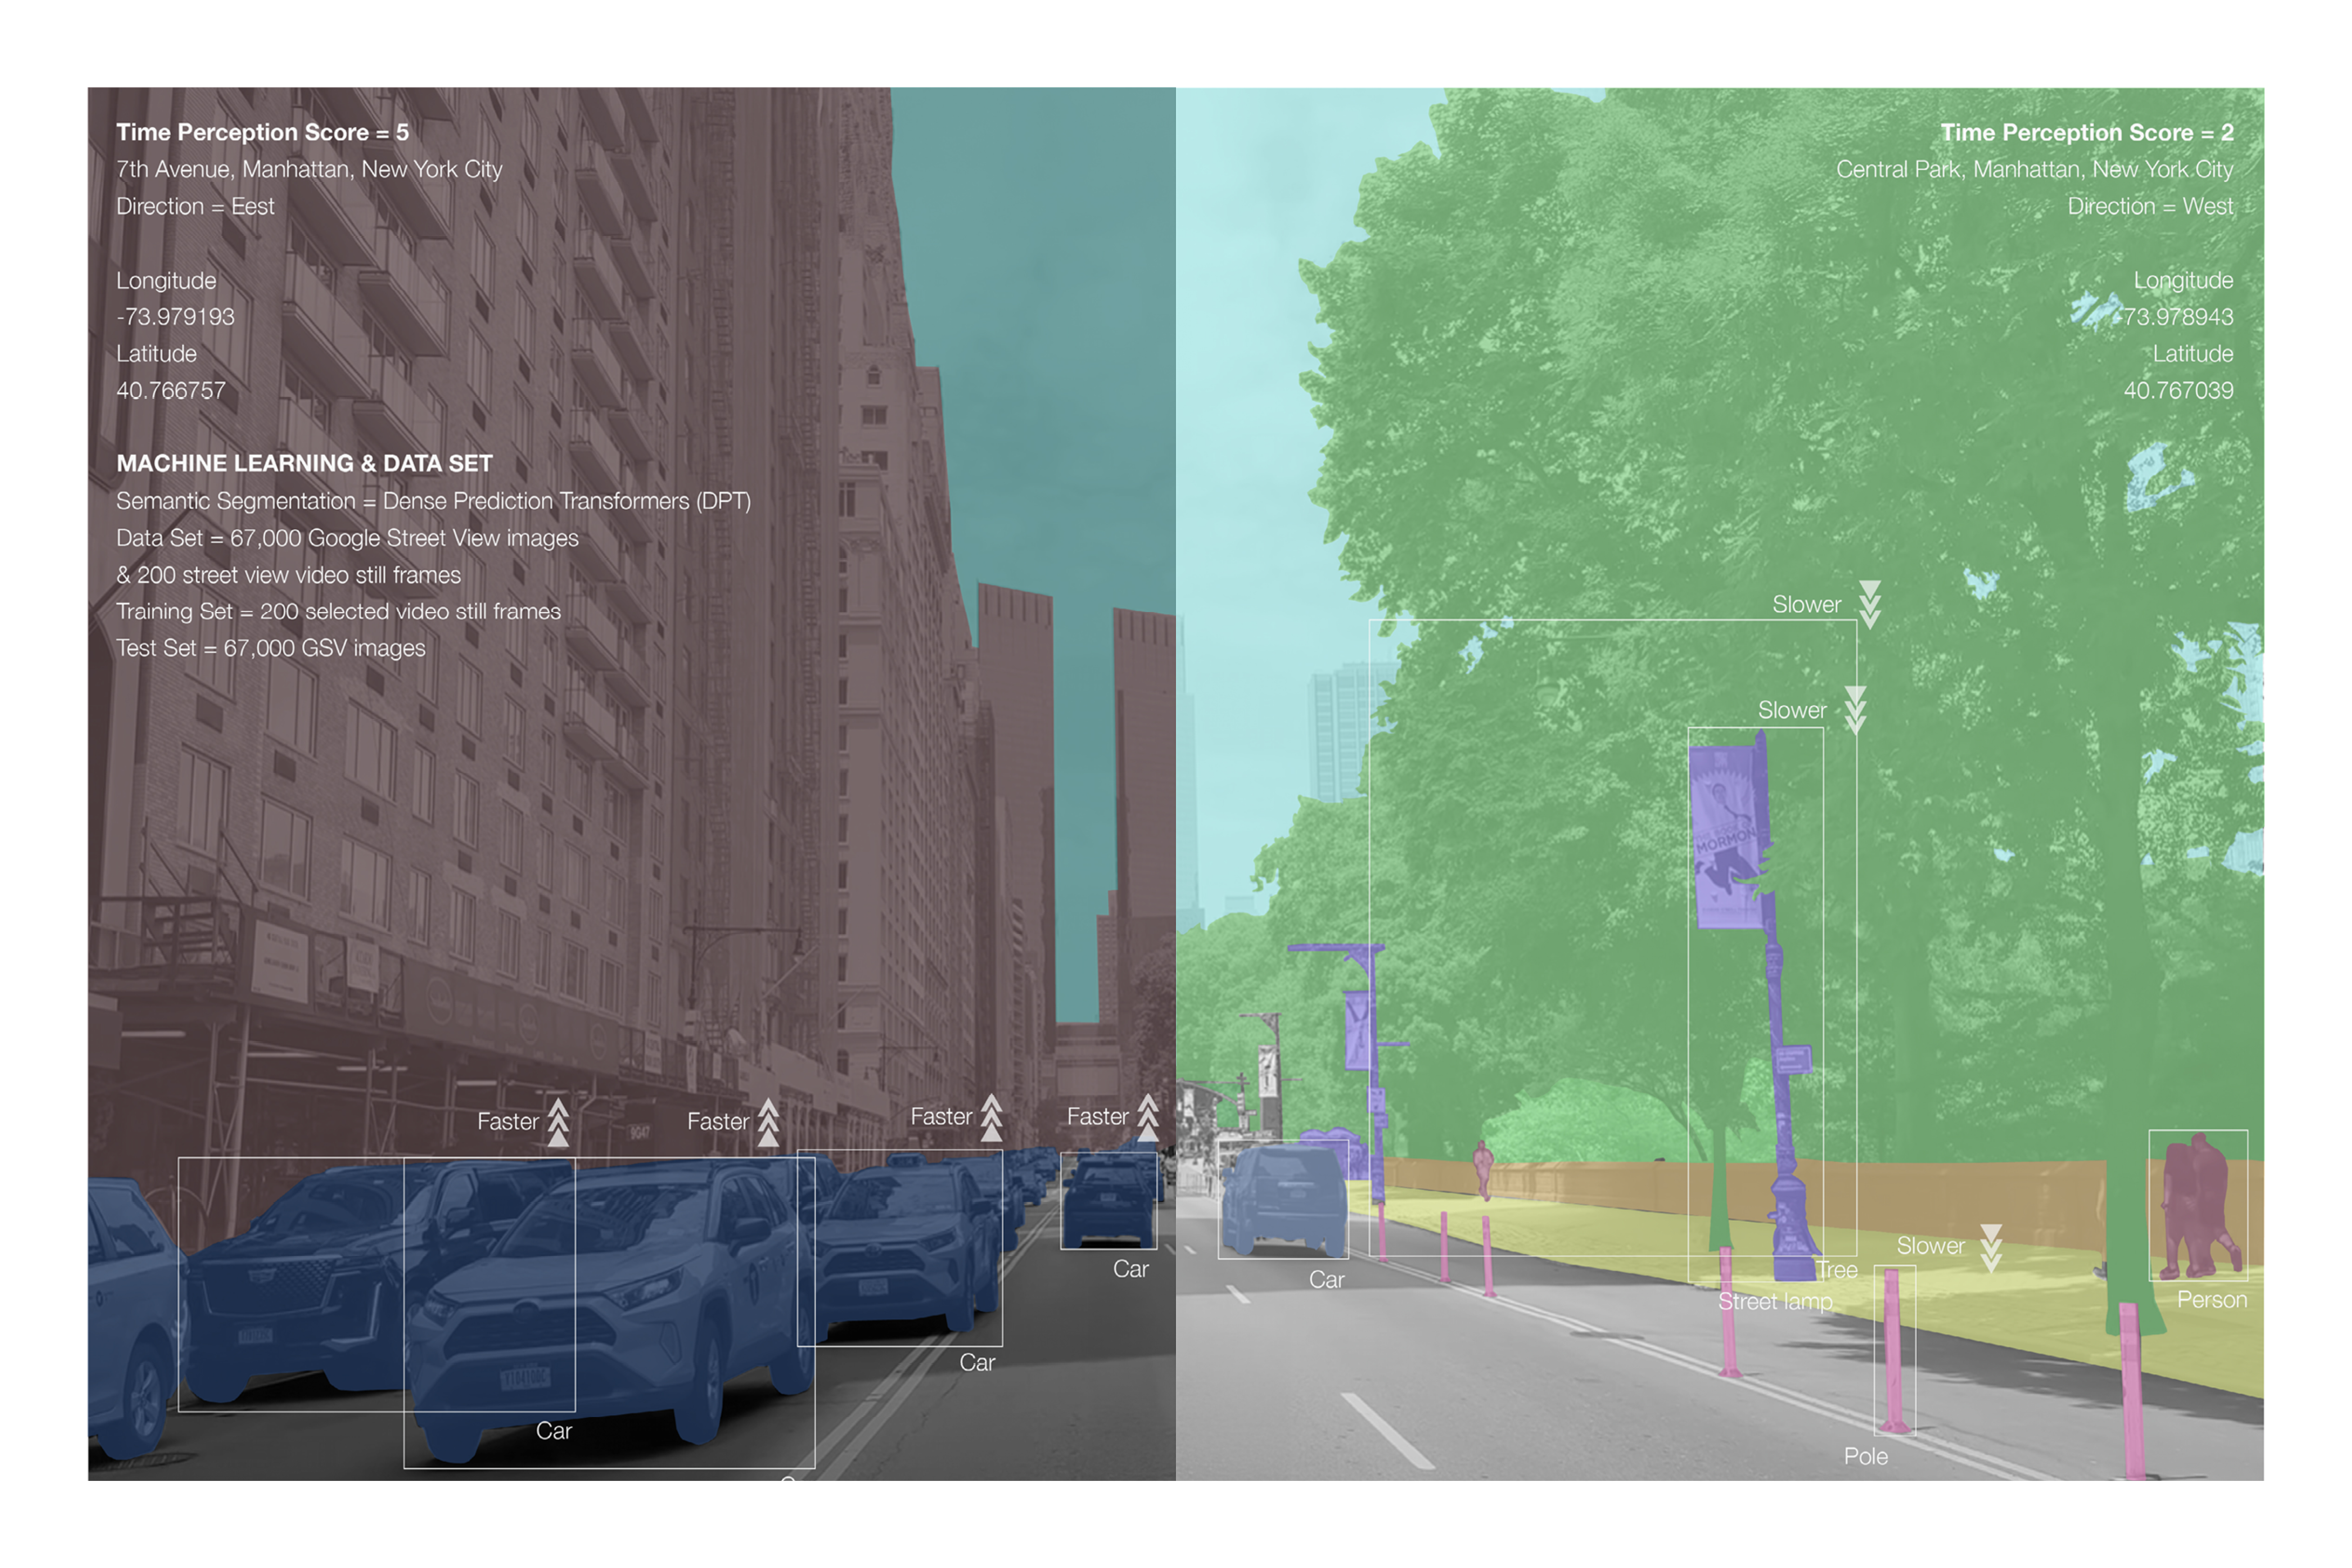
Urban Perceived Speed asks how the visible composition of a street relates to the pace people feel. Contrasting Seventh Avenue with Central Park introduces the project’s focus on perceived temporal speed, rather than physical travel speed.
02 / Research framework
Human judgment as a model input.
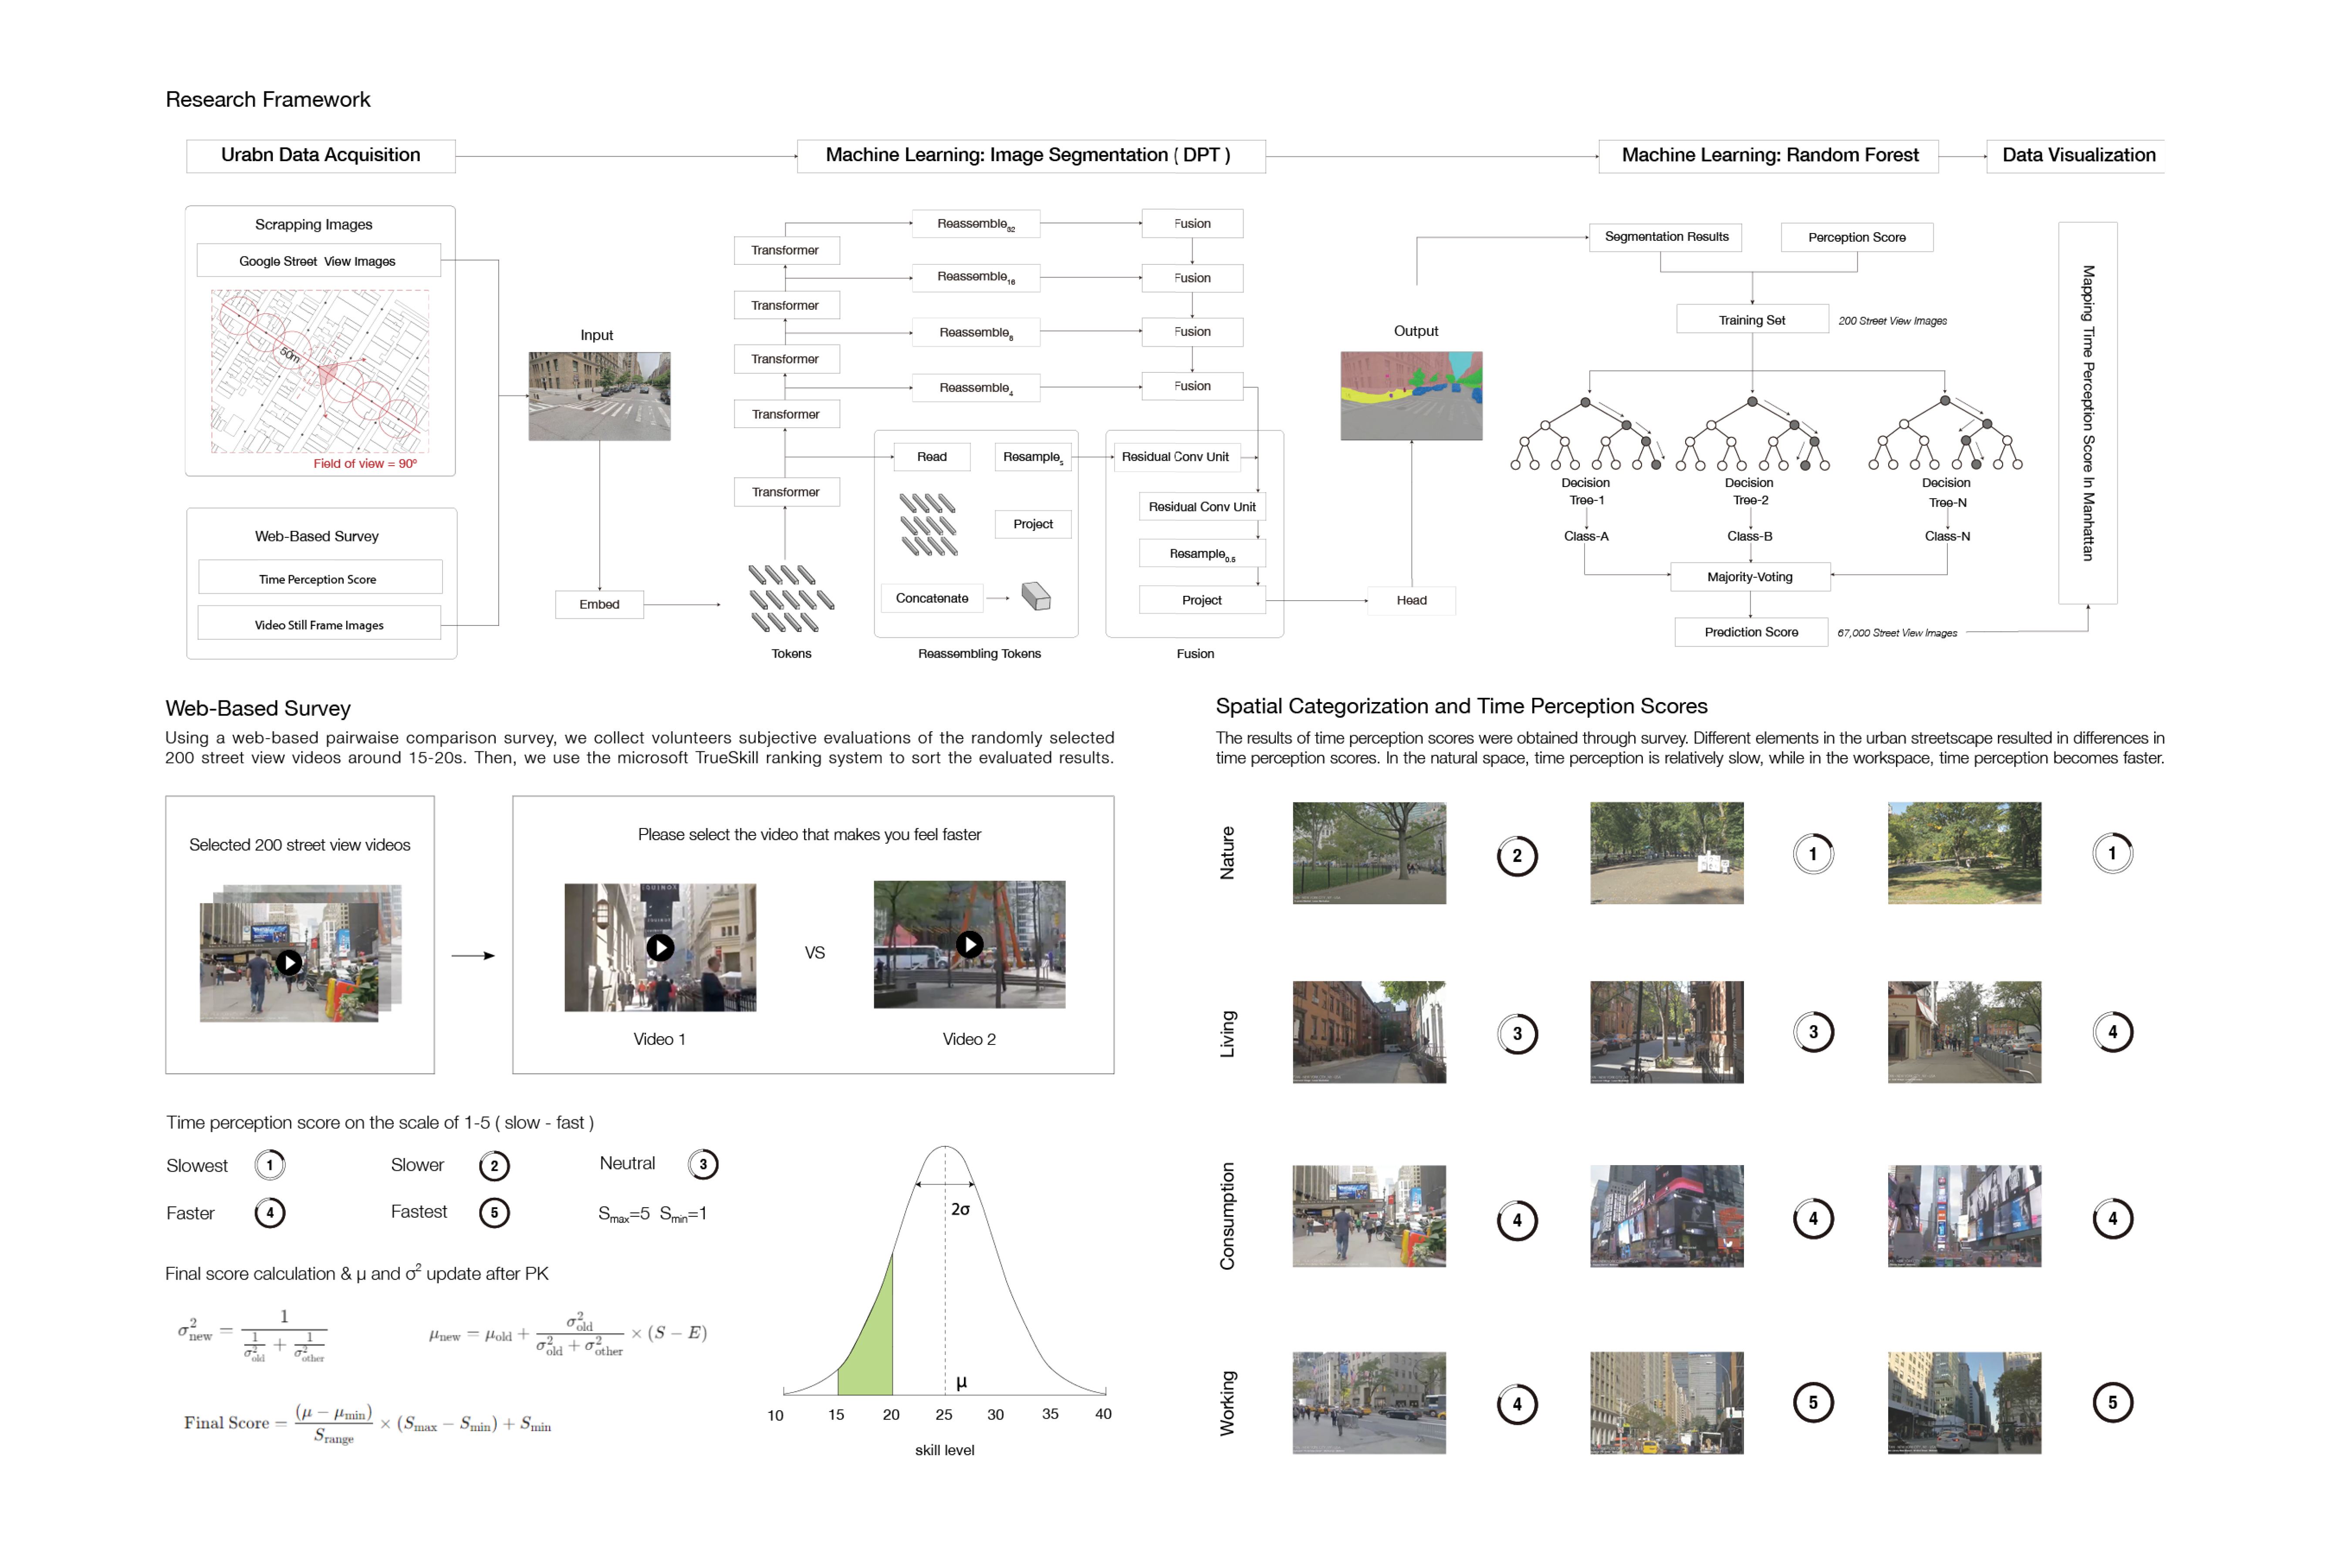
A web-based pairwise survey asked volunteers which of two short street-view videos felt faster. Responses to 200 selected videos were ranked using TrueSkill and translated into a five-point perception scale, providing labels for a model connecting streetscape features with perceived speed.
03 / Computational method
Translating street scenes into features.
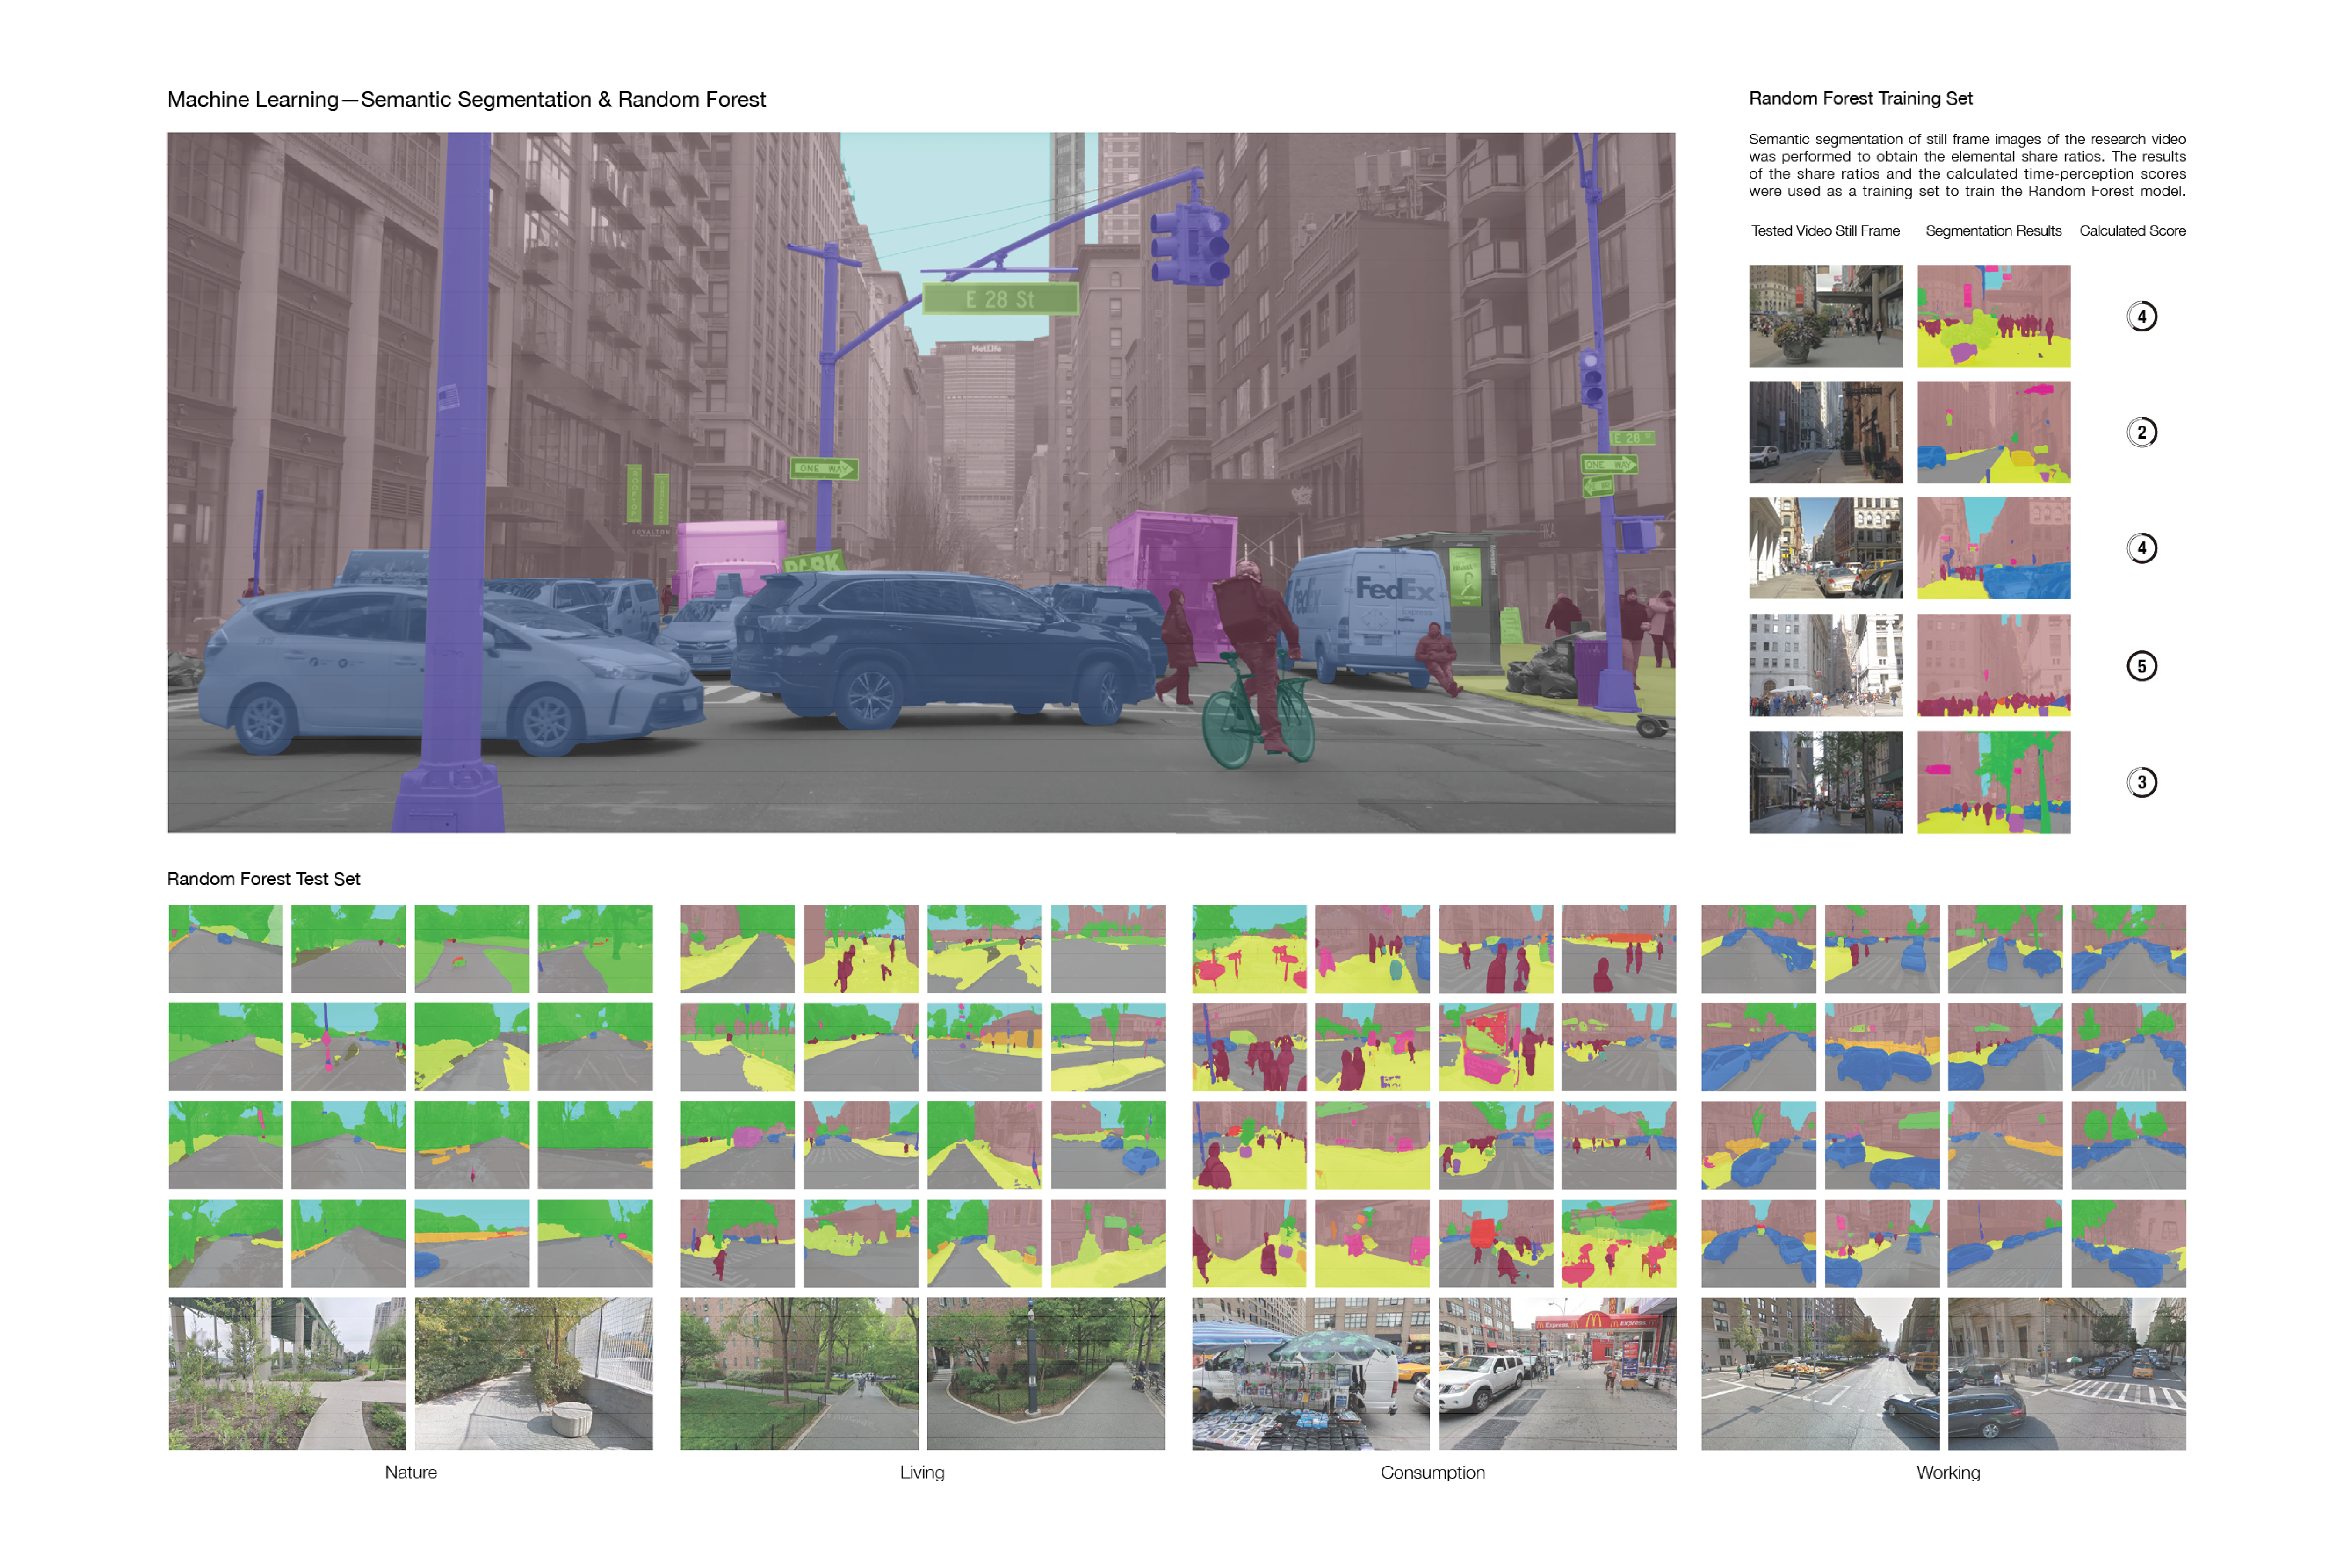
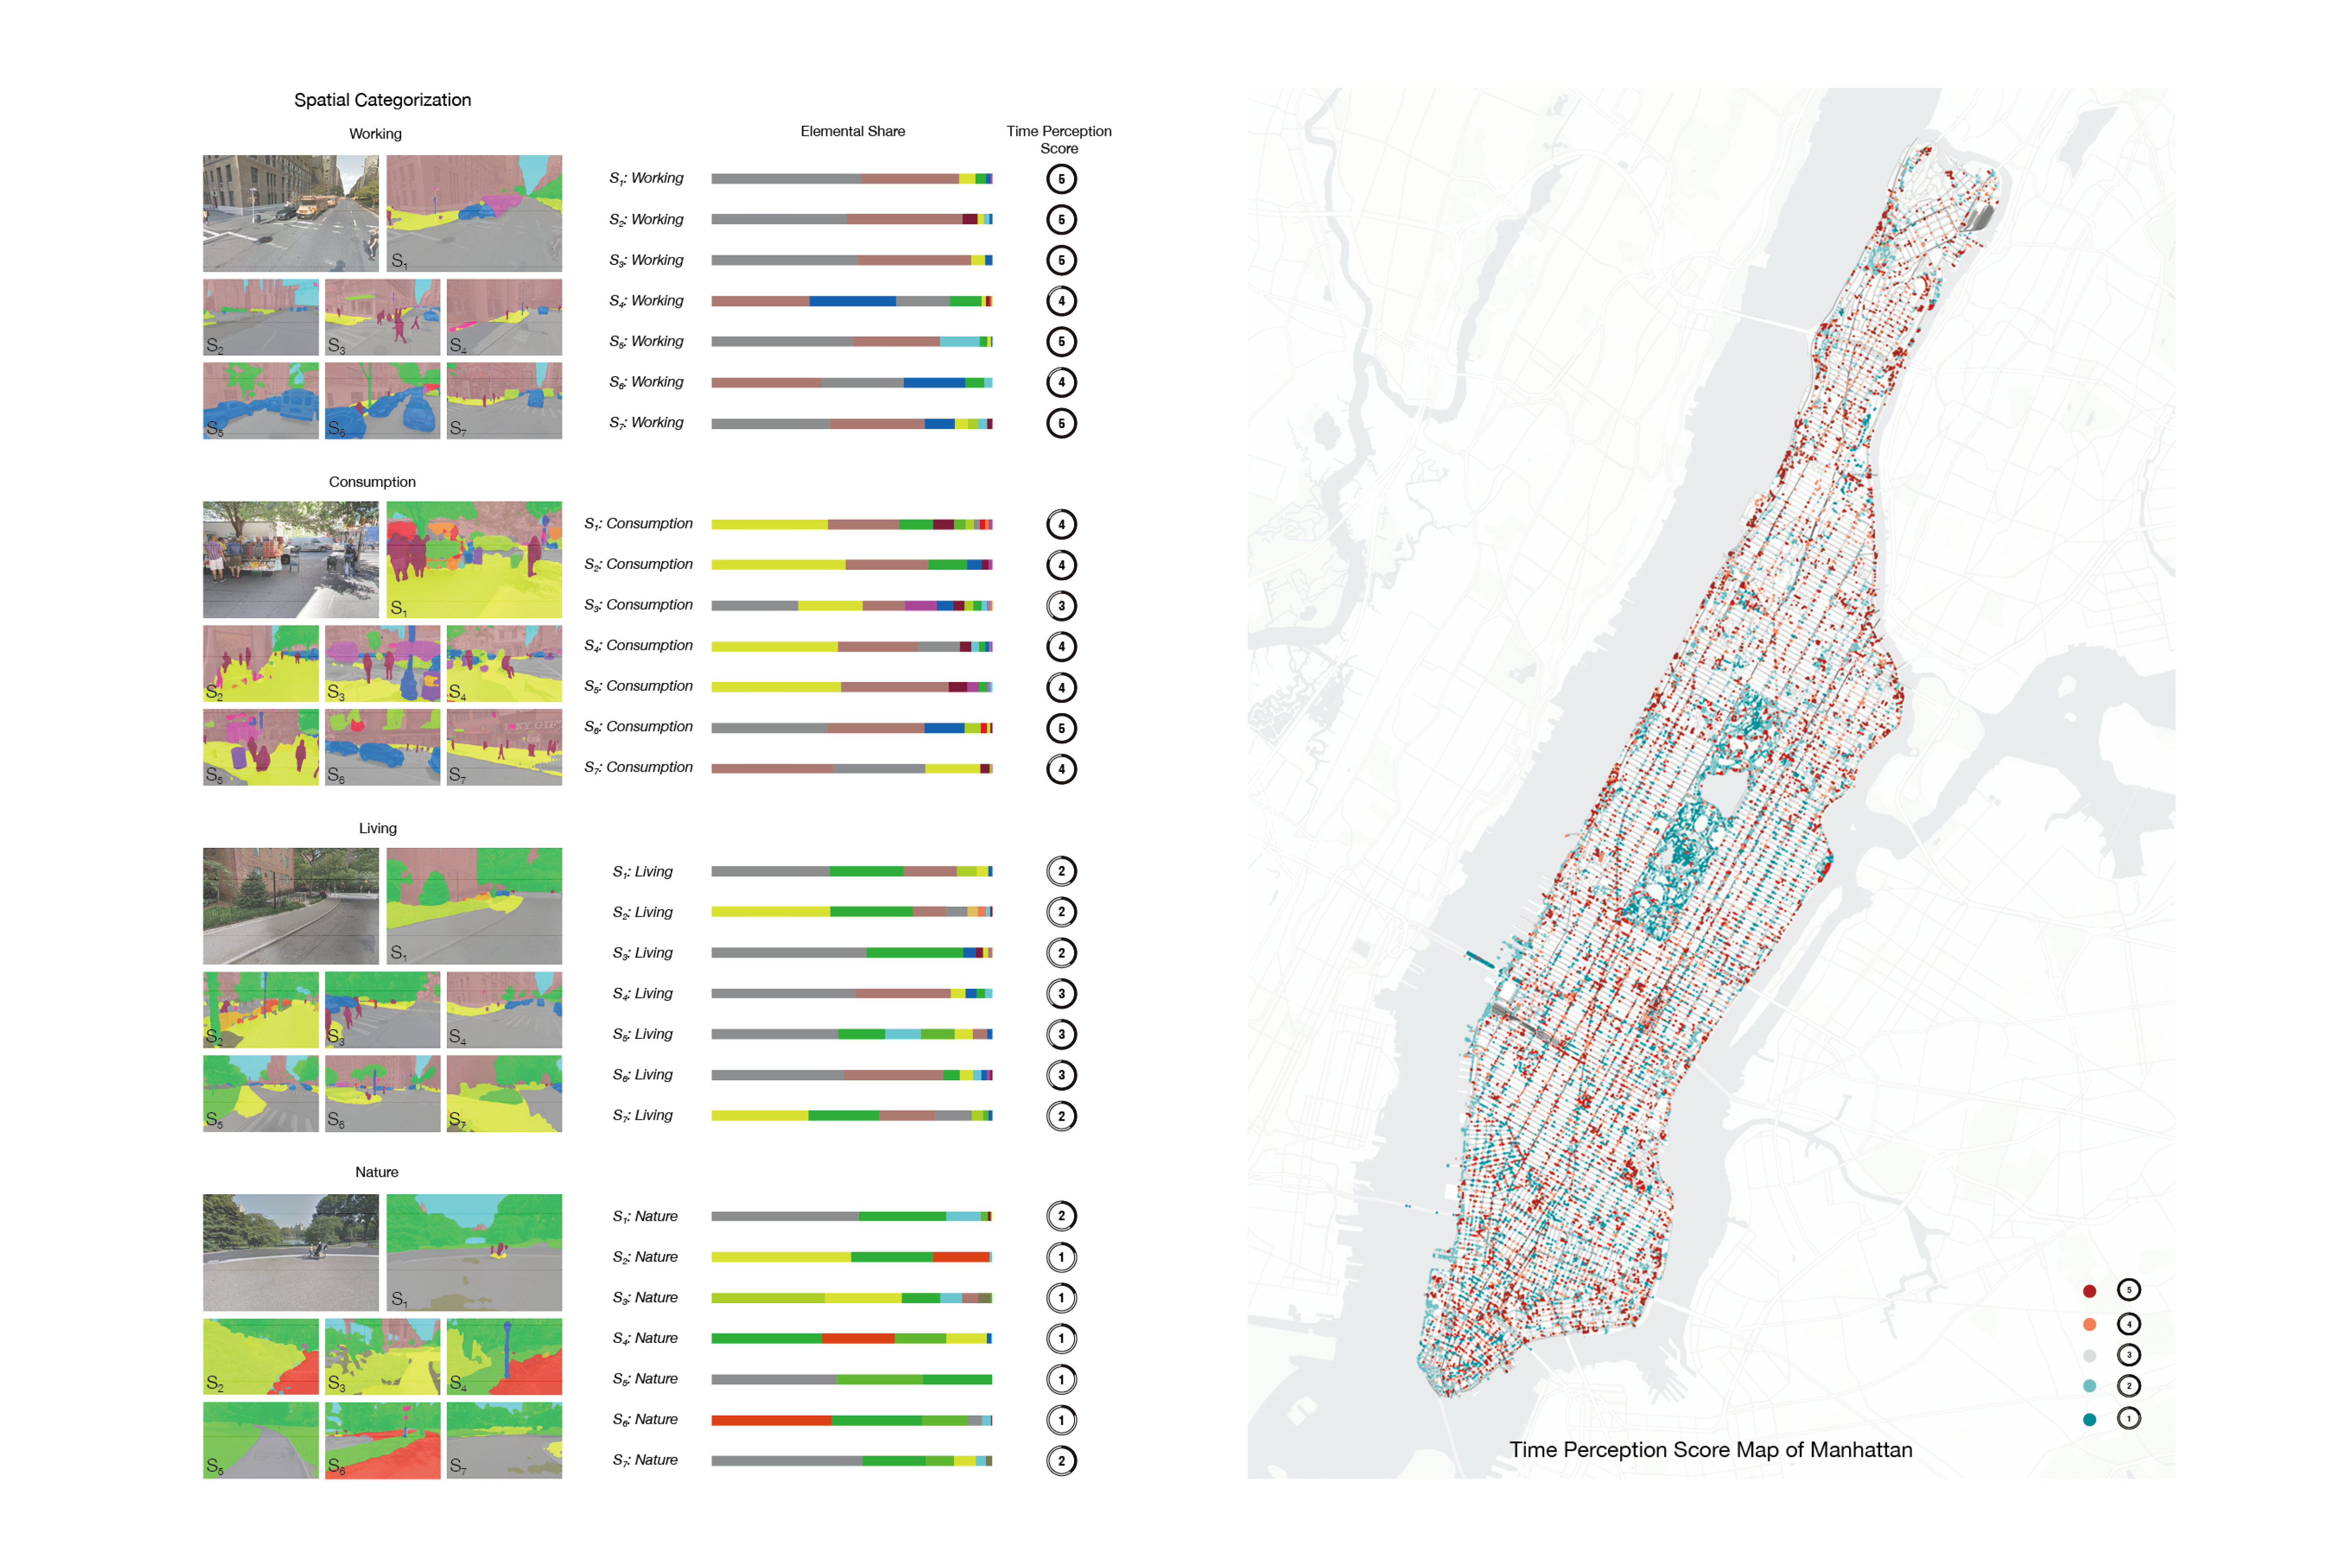
Dense Prediction Transformers segmented street imagery into visual elements. Elemental proportions from selected video stills were paired with perception scores to train a random forest model, which was then applied to a larger collection of 67,000 Google Street View images.
04 / Spatial features
Reading the city in layers.
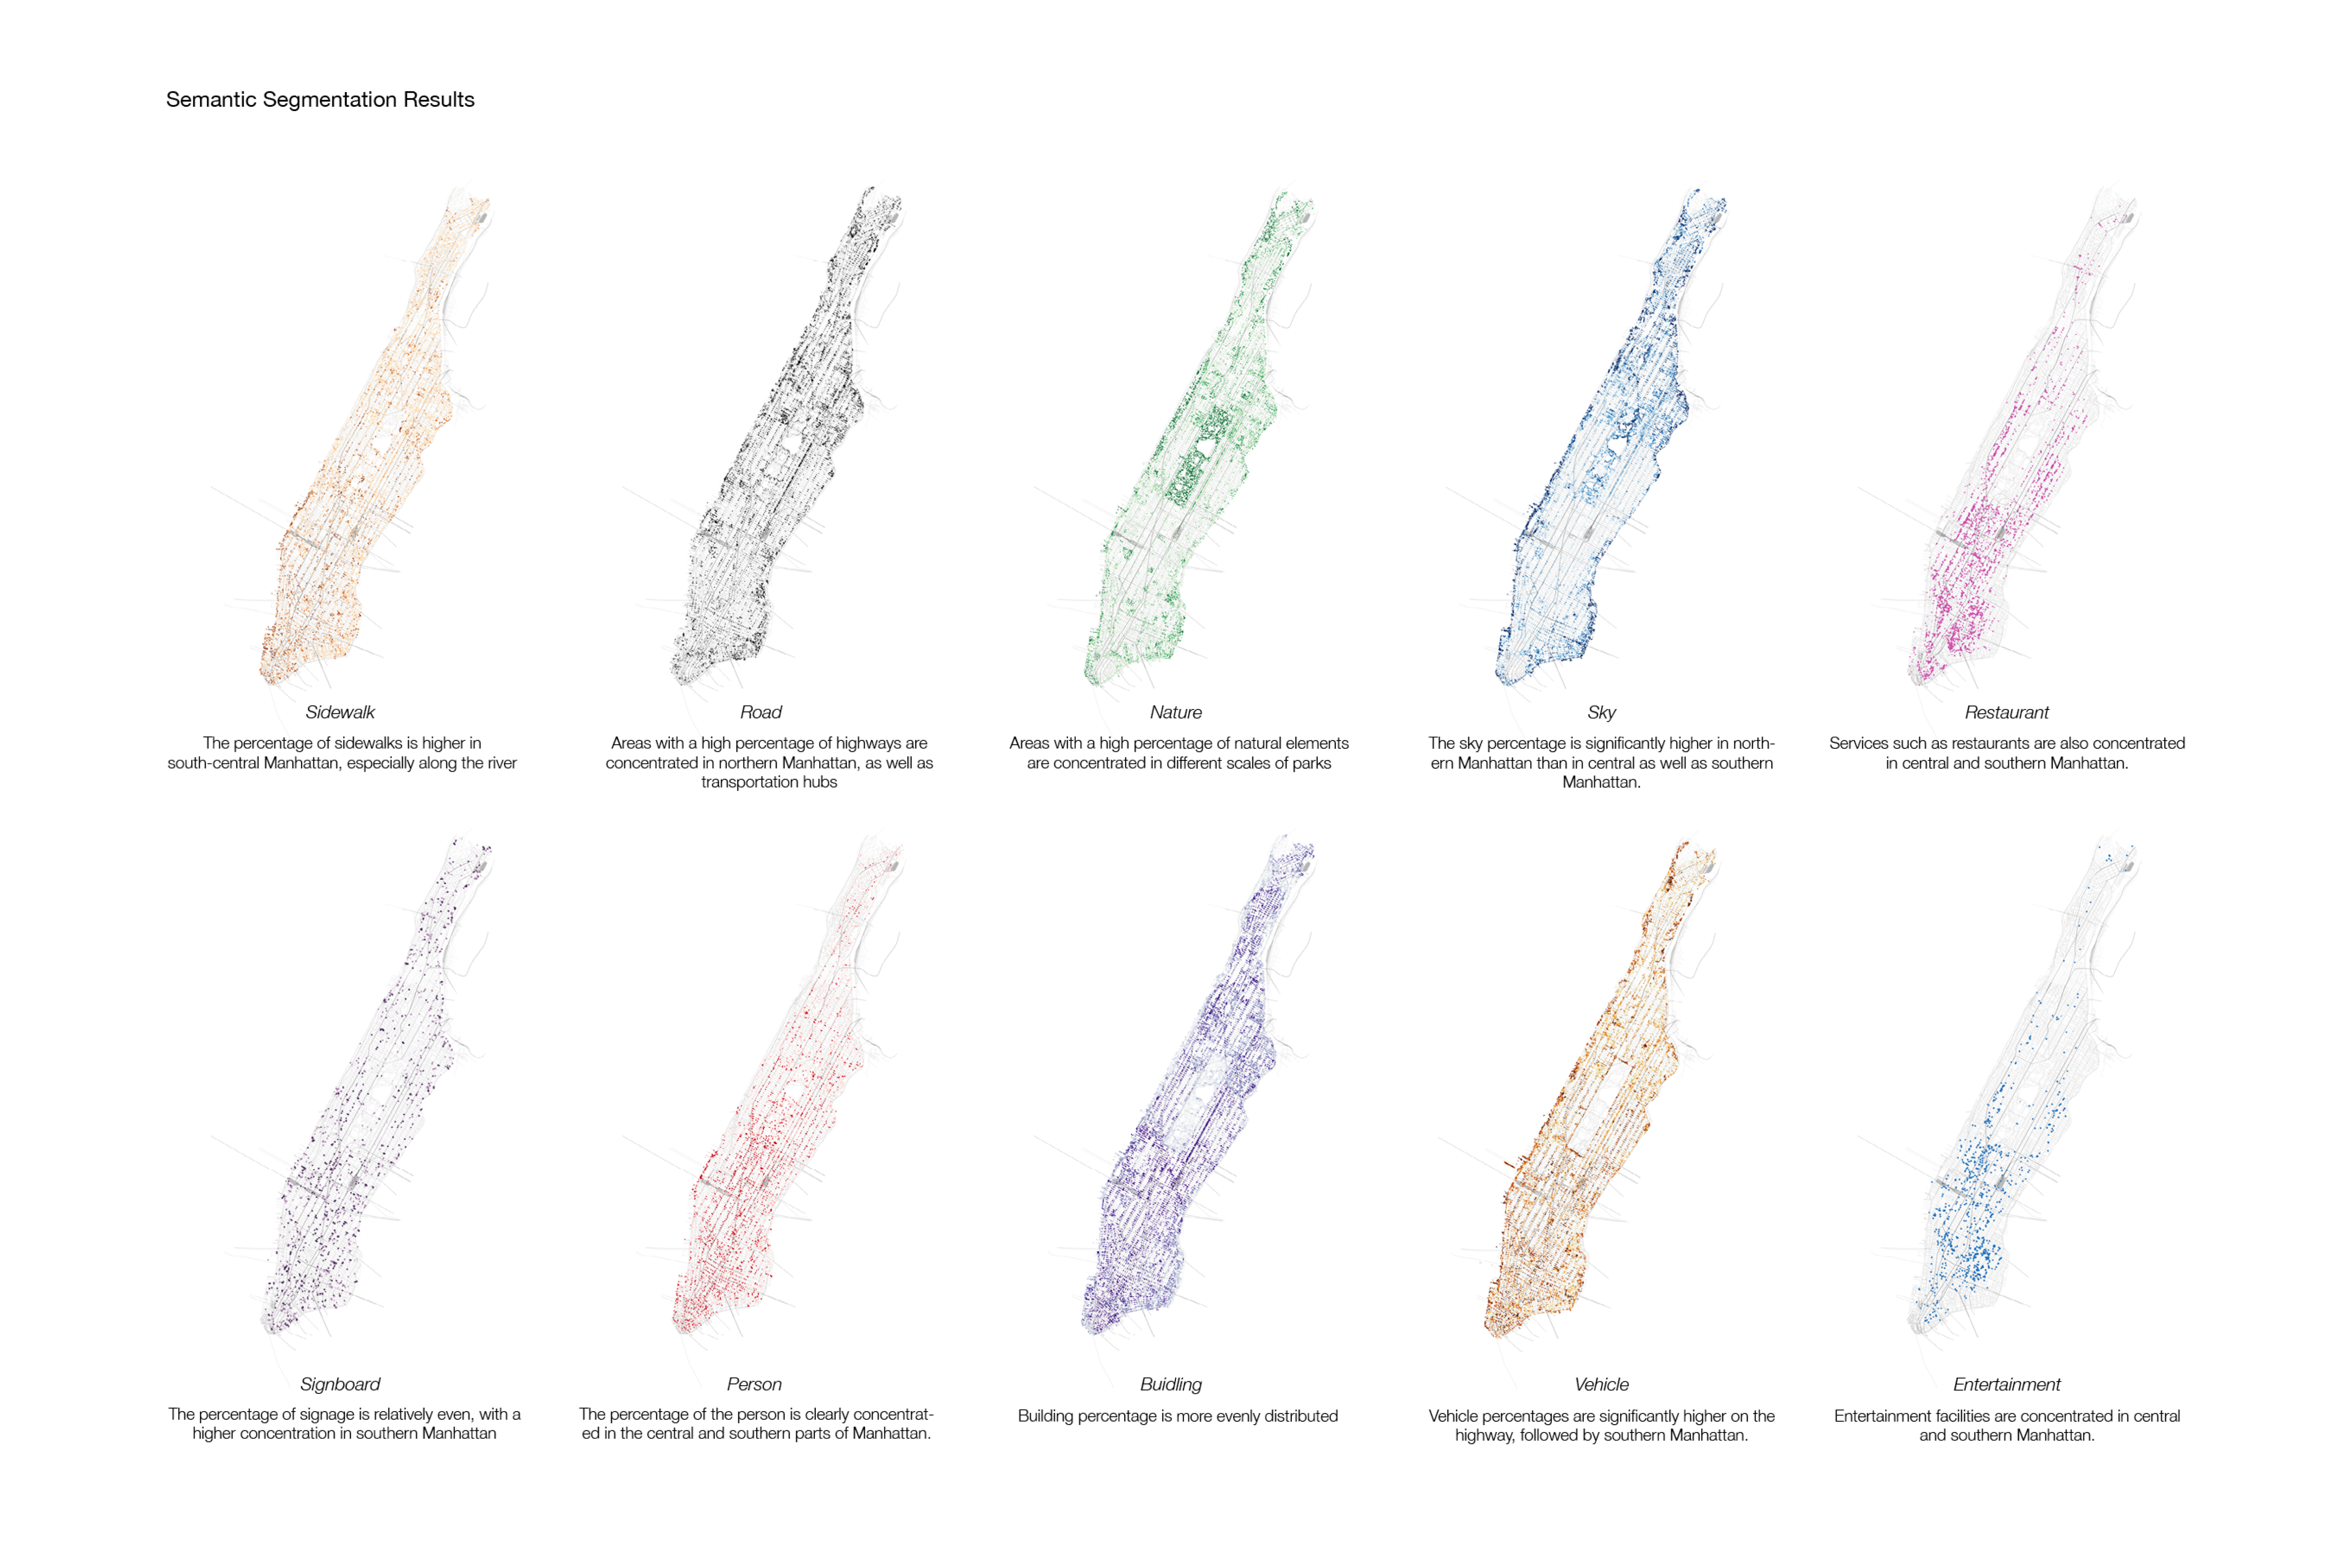
Mapping individual visual elements reveals different spatial distributions across Manhattan. Sidewalks, roads, nature, sky, buildings, people, and other features form a set of layers through which the project examines the composition of urban experience.
05 / Perceived speed
From individual scenes to a citywide map.
The analysis compares working, consumption, living, and natural environments through their feature proportions and perception scores. The resulting map extends these relationships across Manhattan, with warmer colors indicating faster perceived time and cooler colors indicating slower perceived time.
06 / Temporal variation
A place does not keep one rhythm.
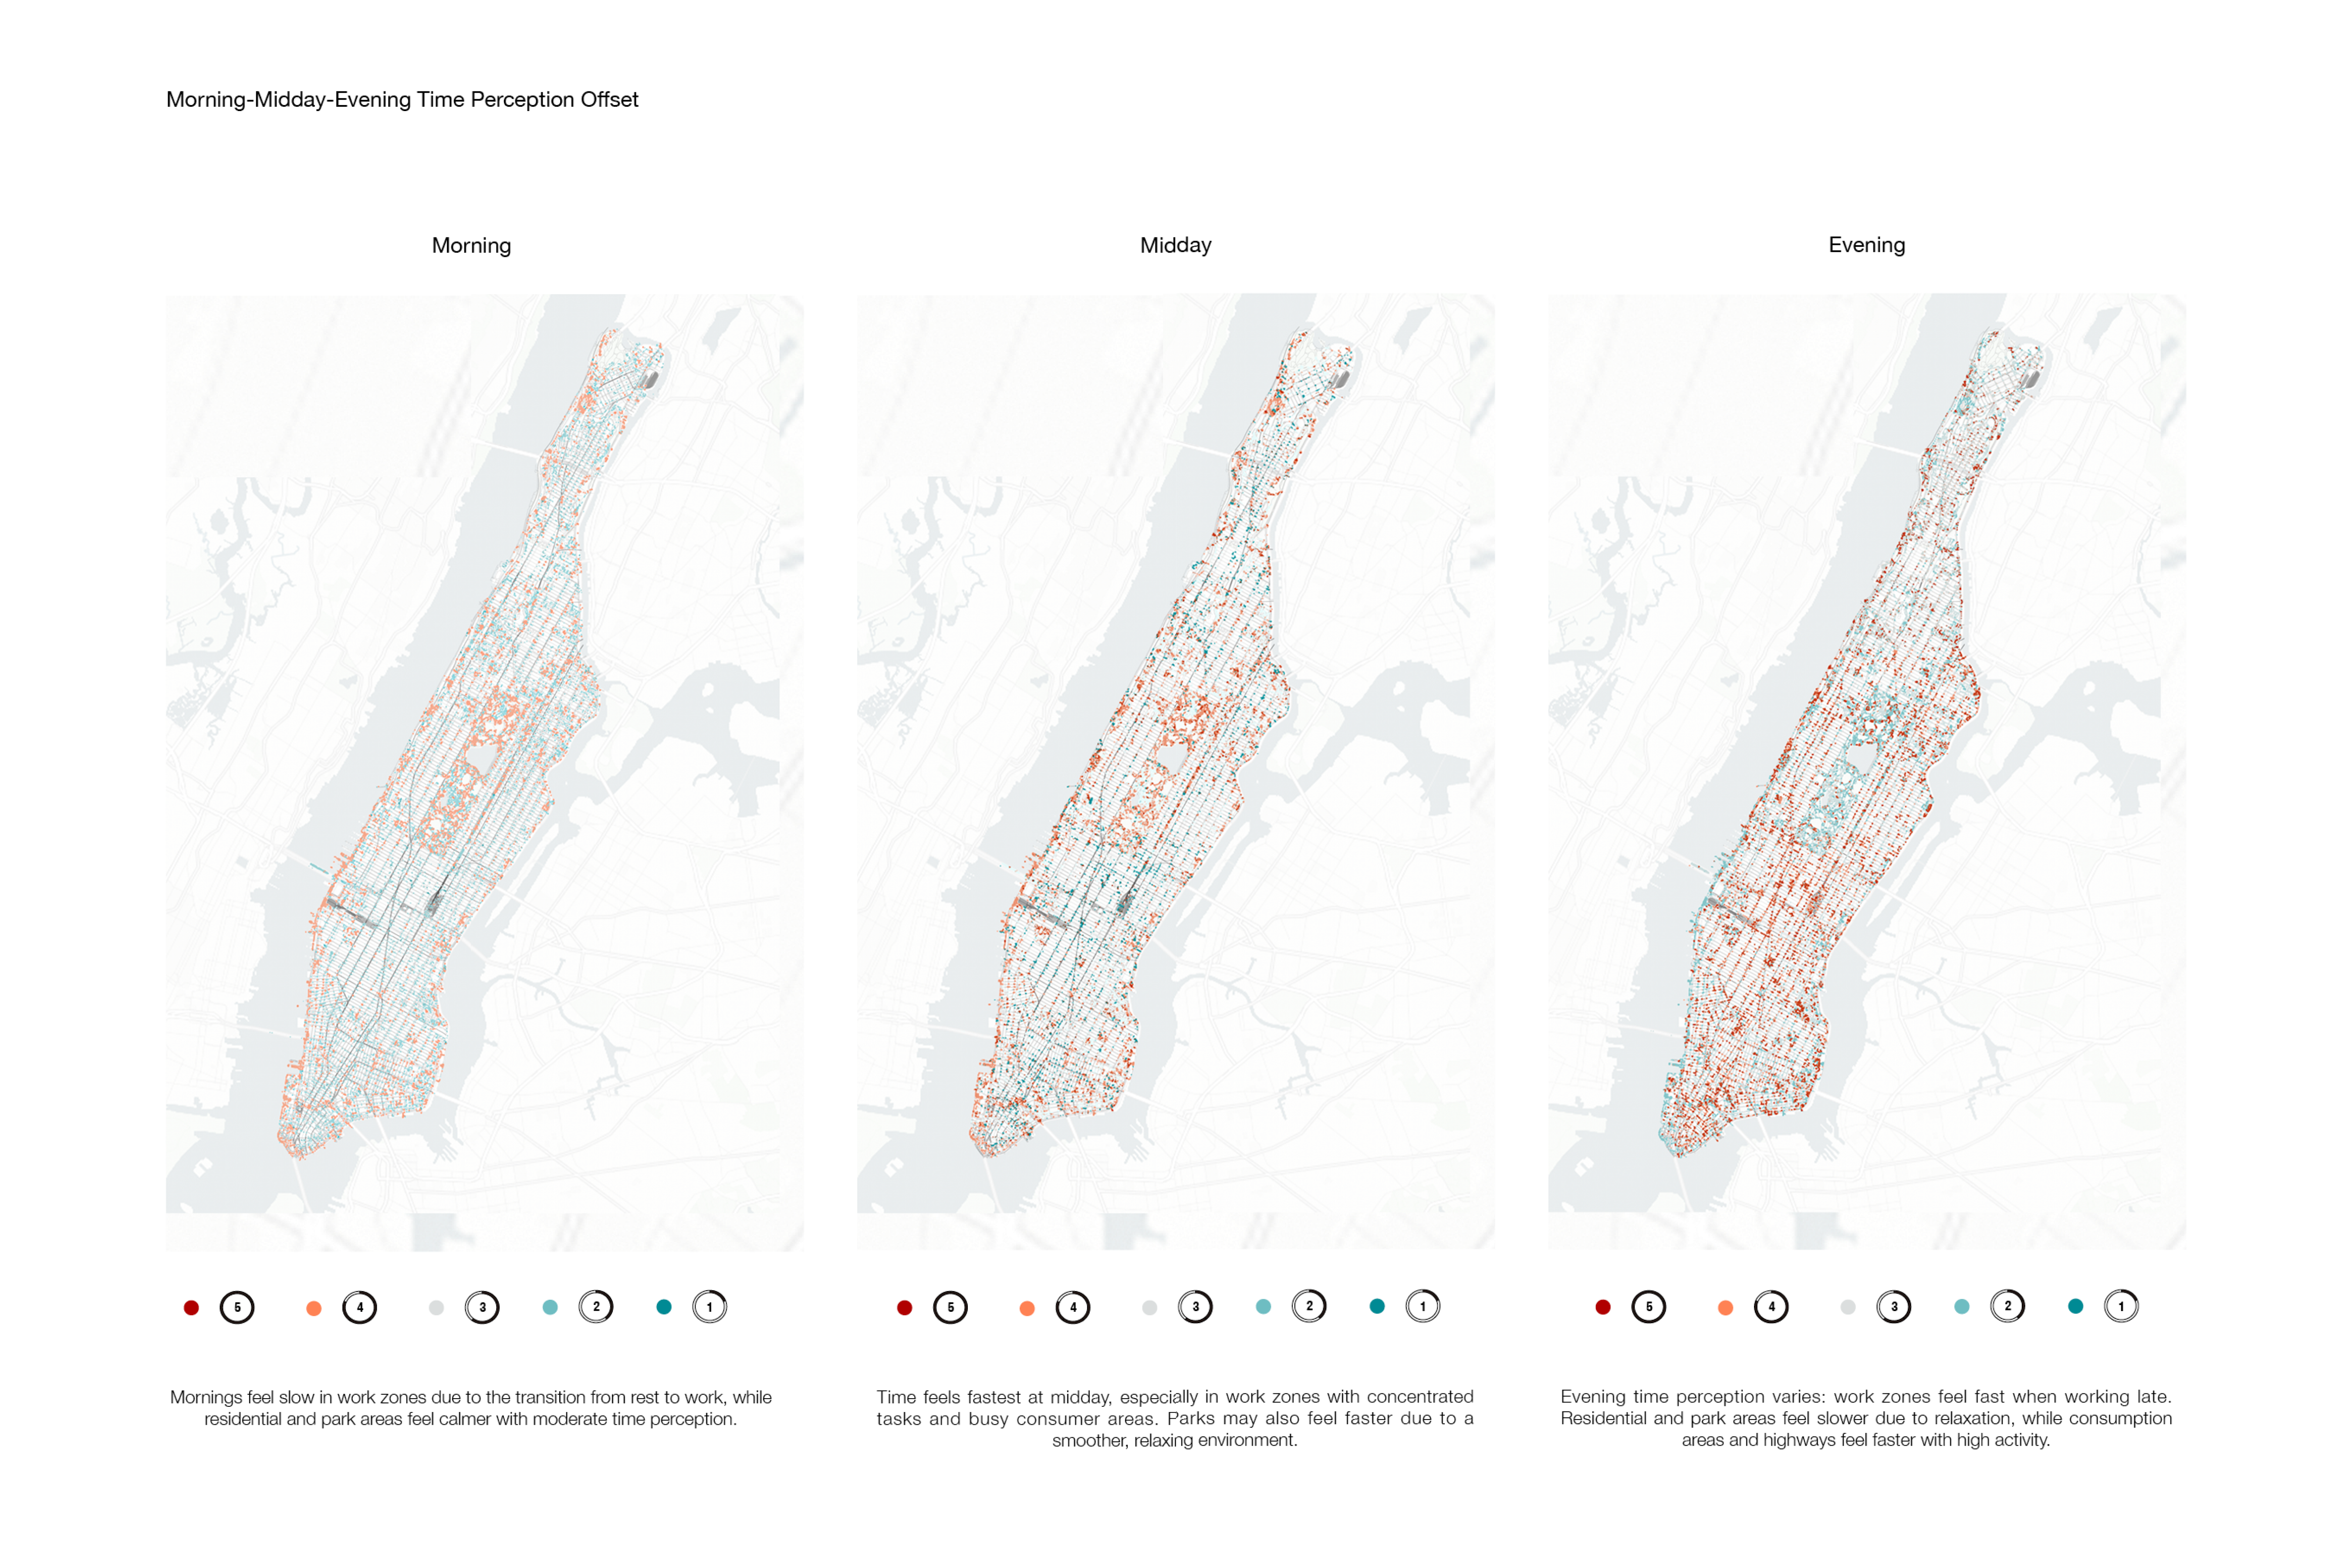
Morning, midday, and evening maps explore how perceived pace may shift over the course of a day. These comparisons bring a temporal dimension to the spatial analysis, examining the changing rhythms of working, residential, commercial, and natural environments.
07 / Lower Manhattan
Giving temporal differences a spatial form.
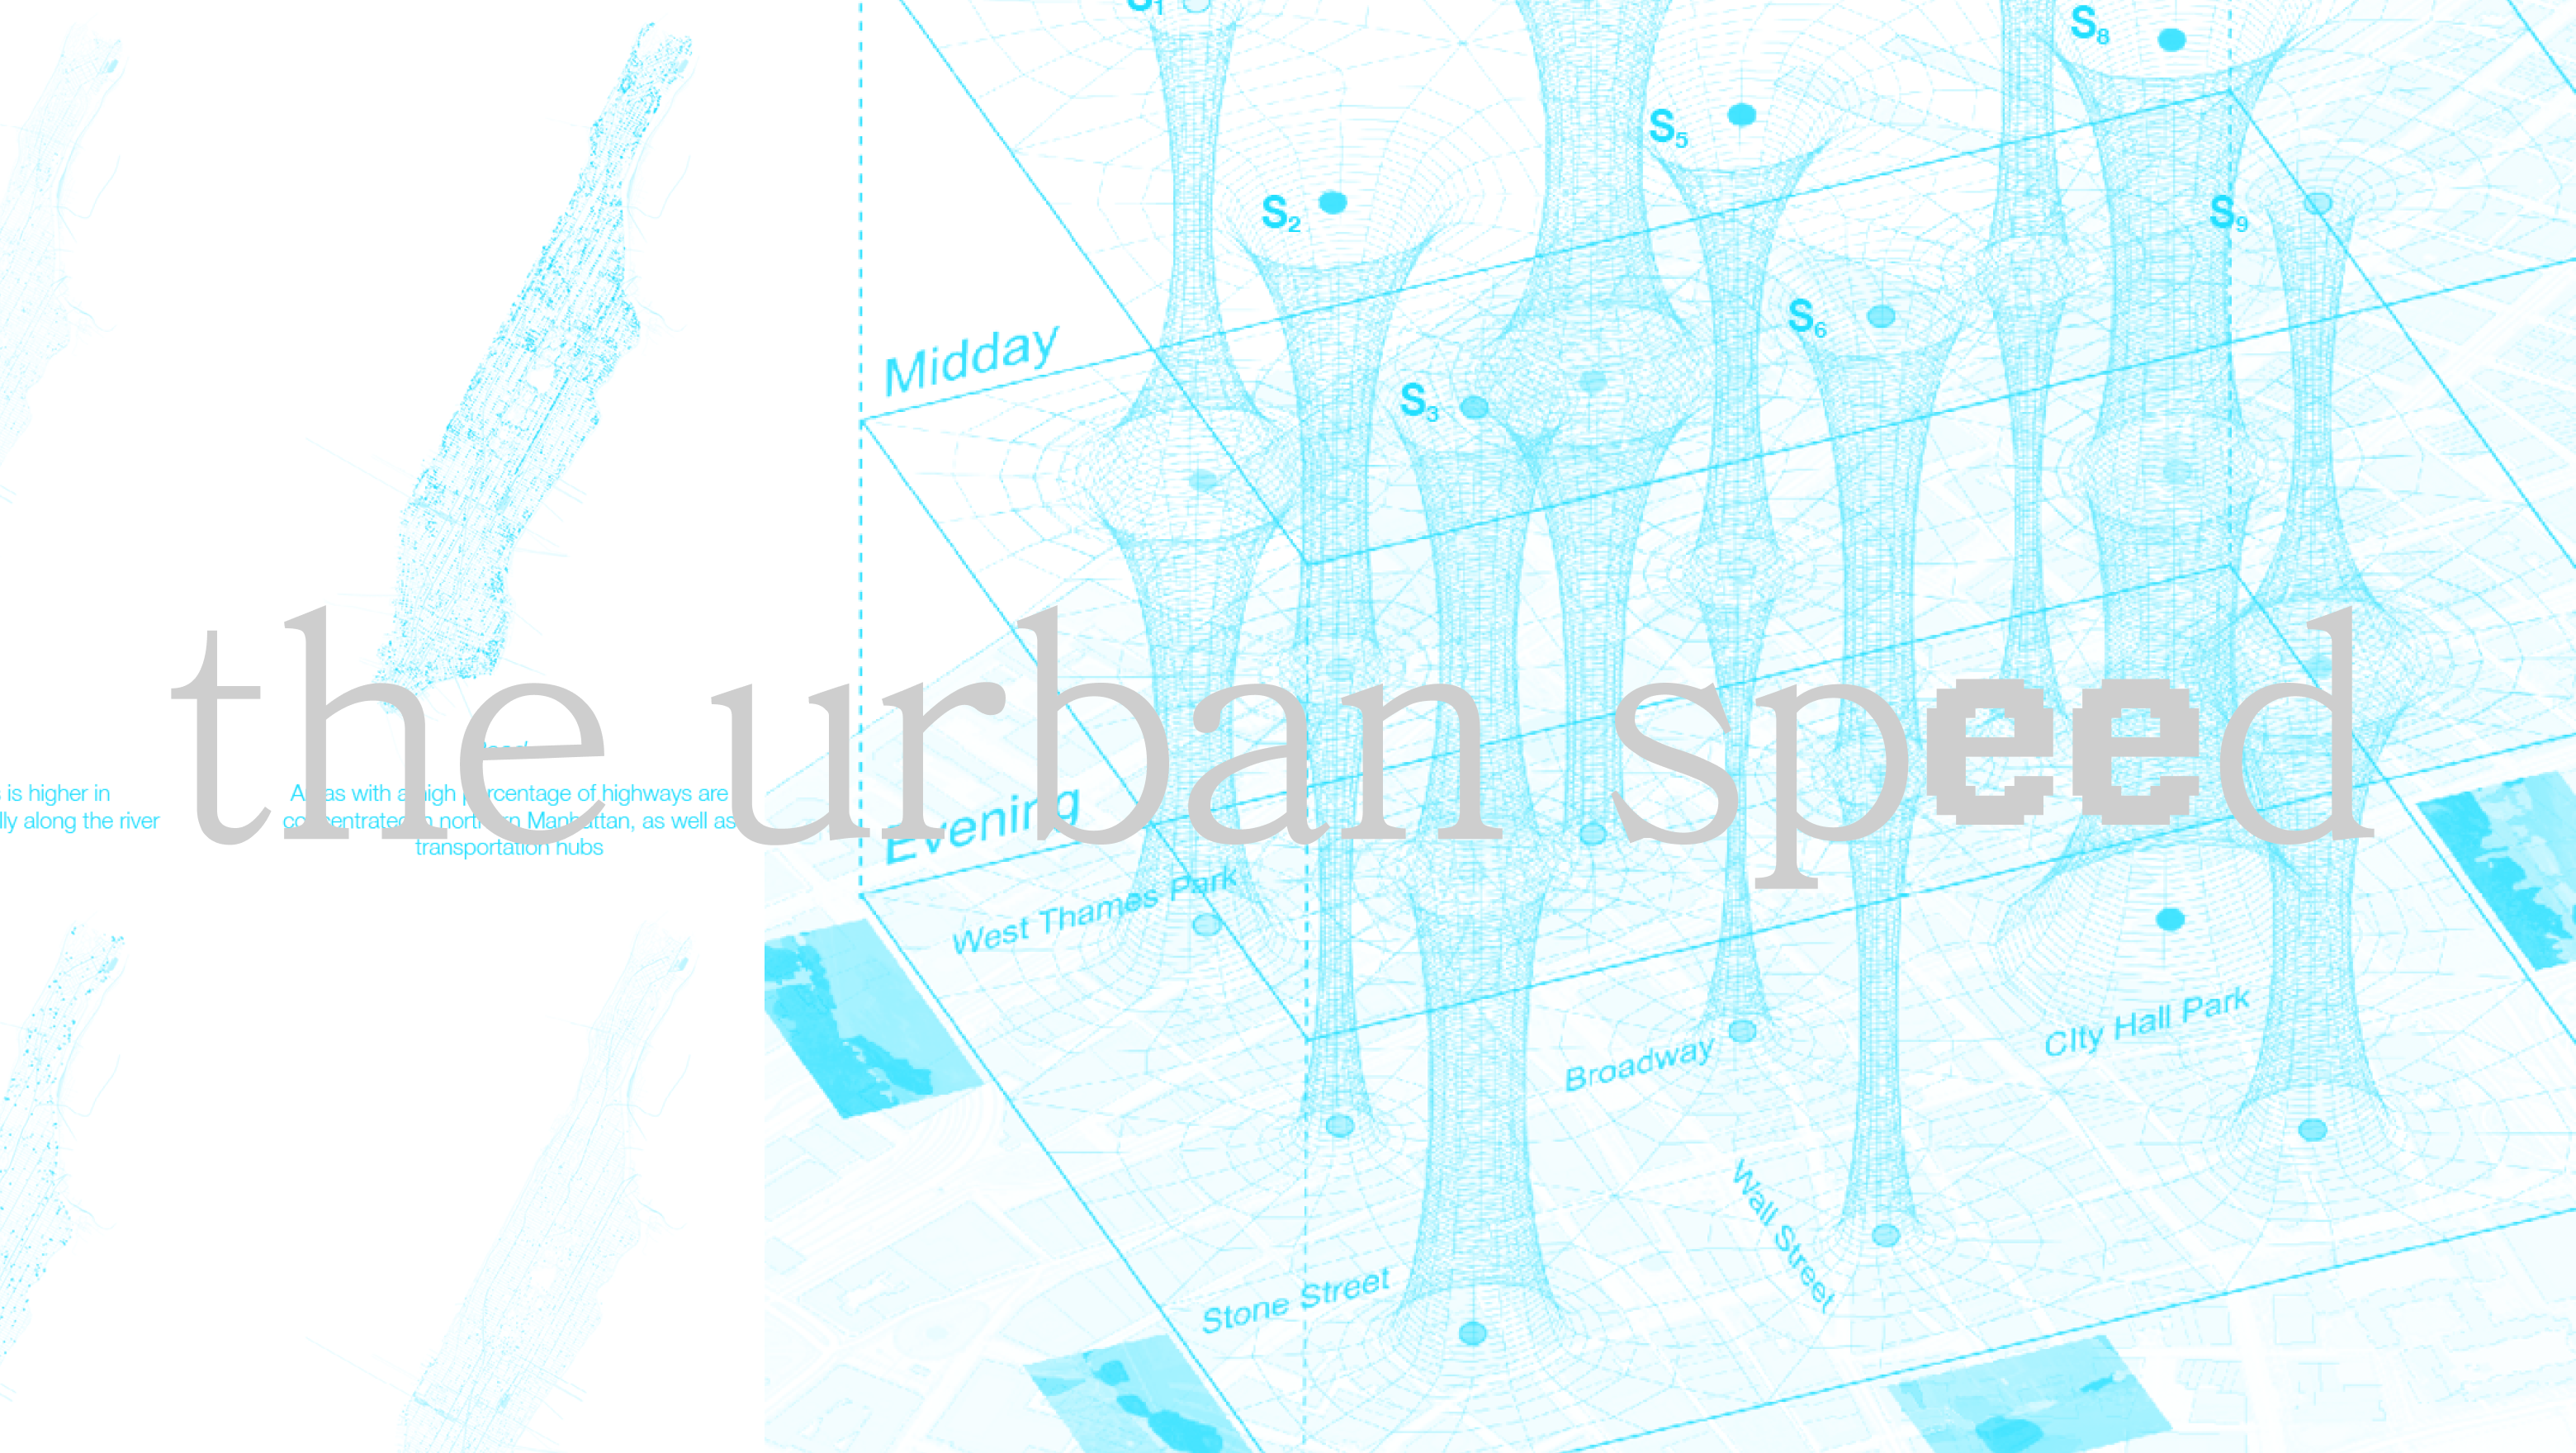
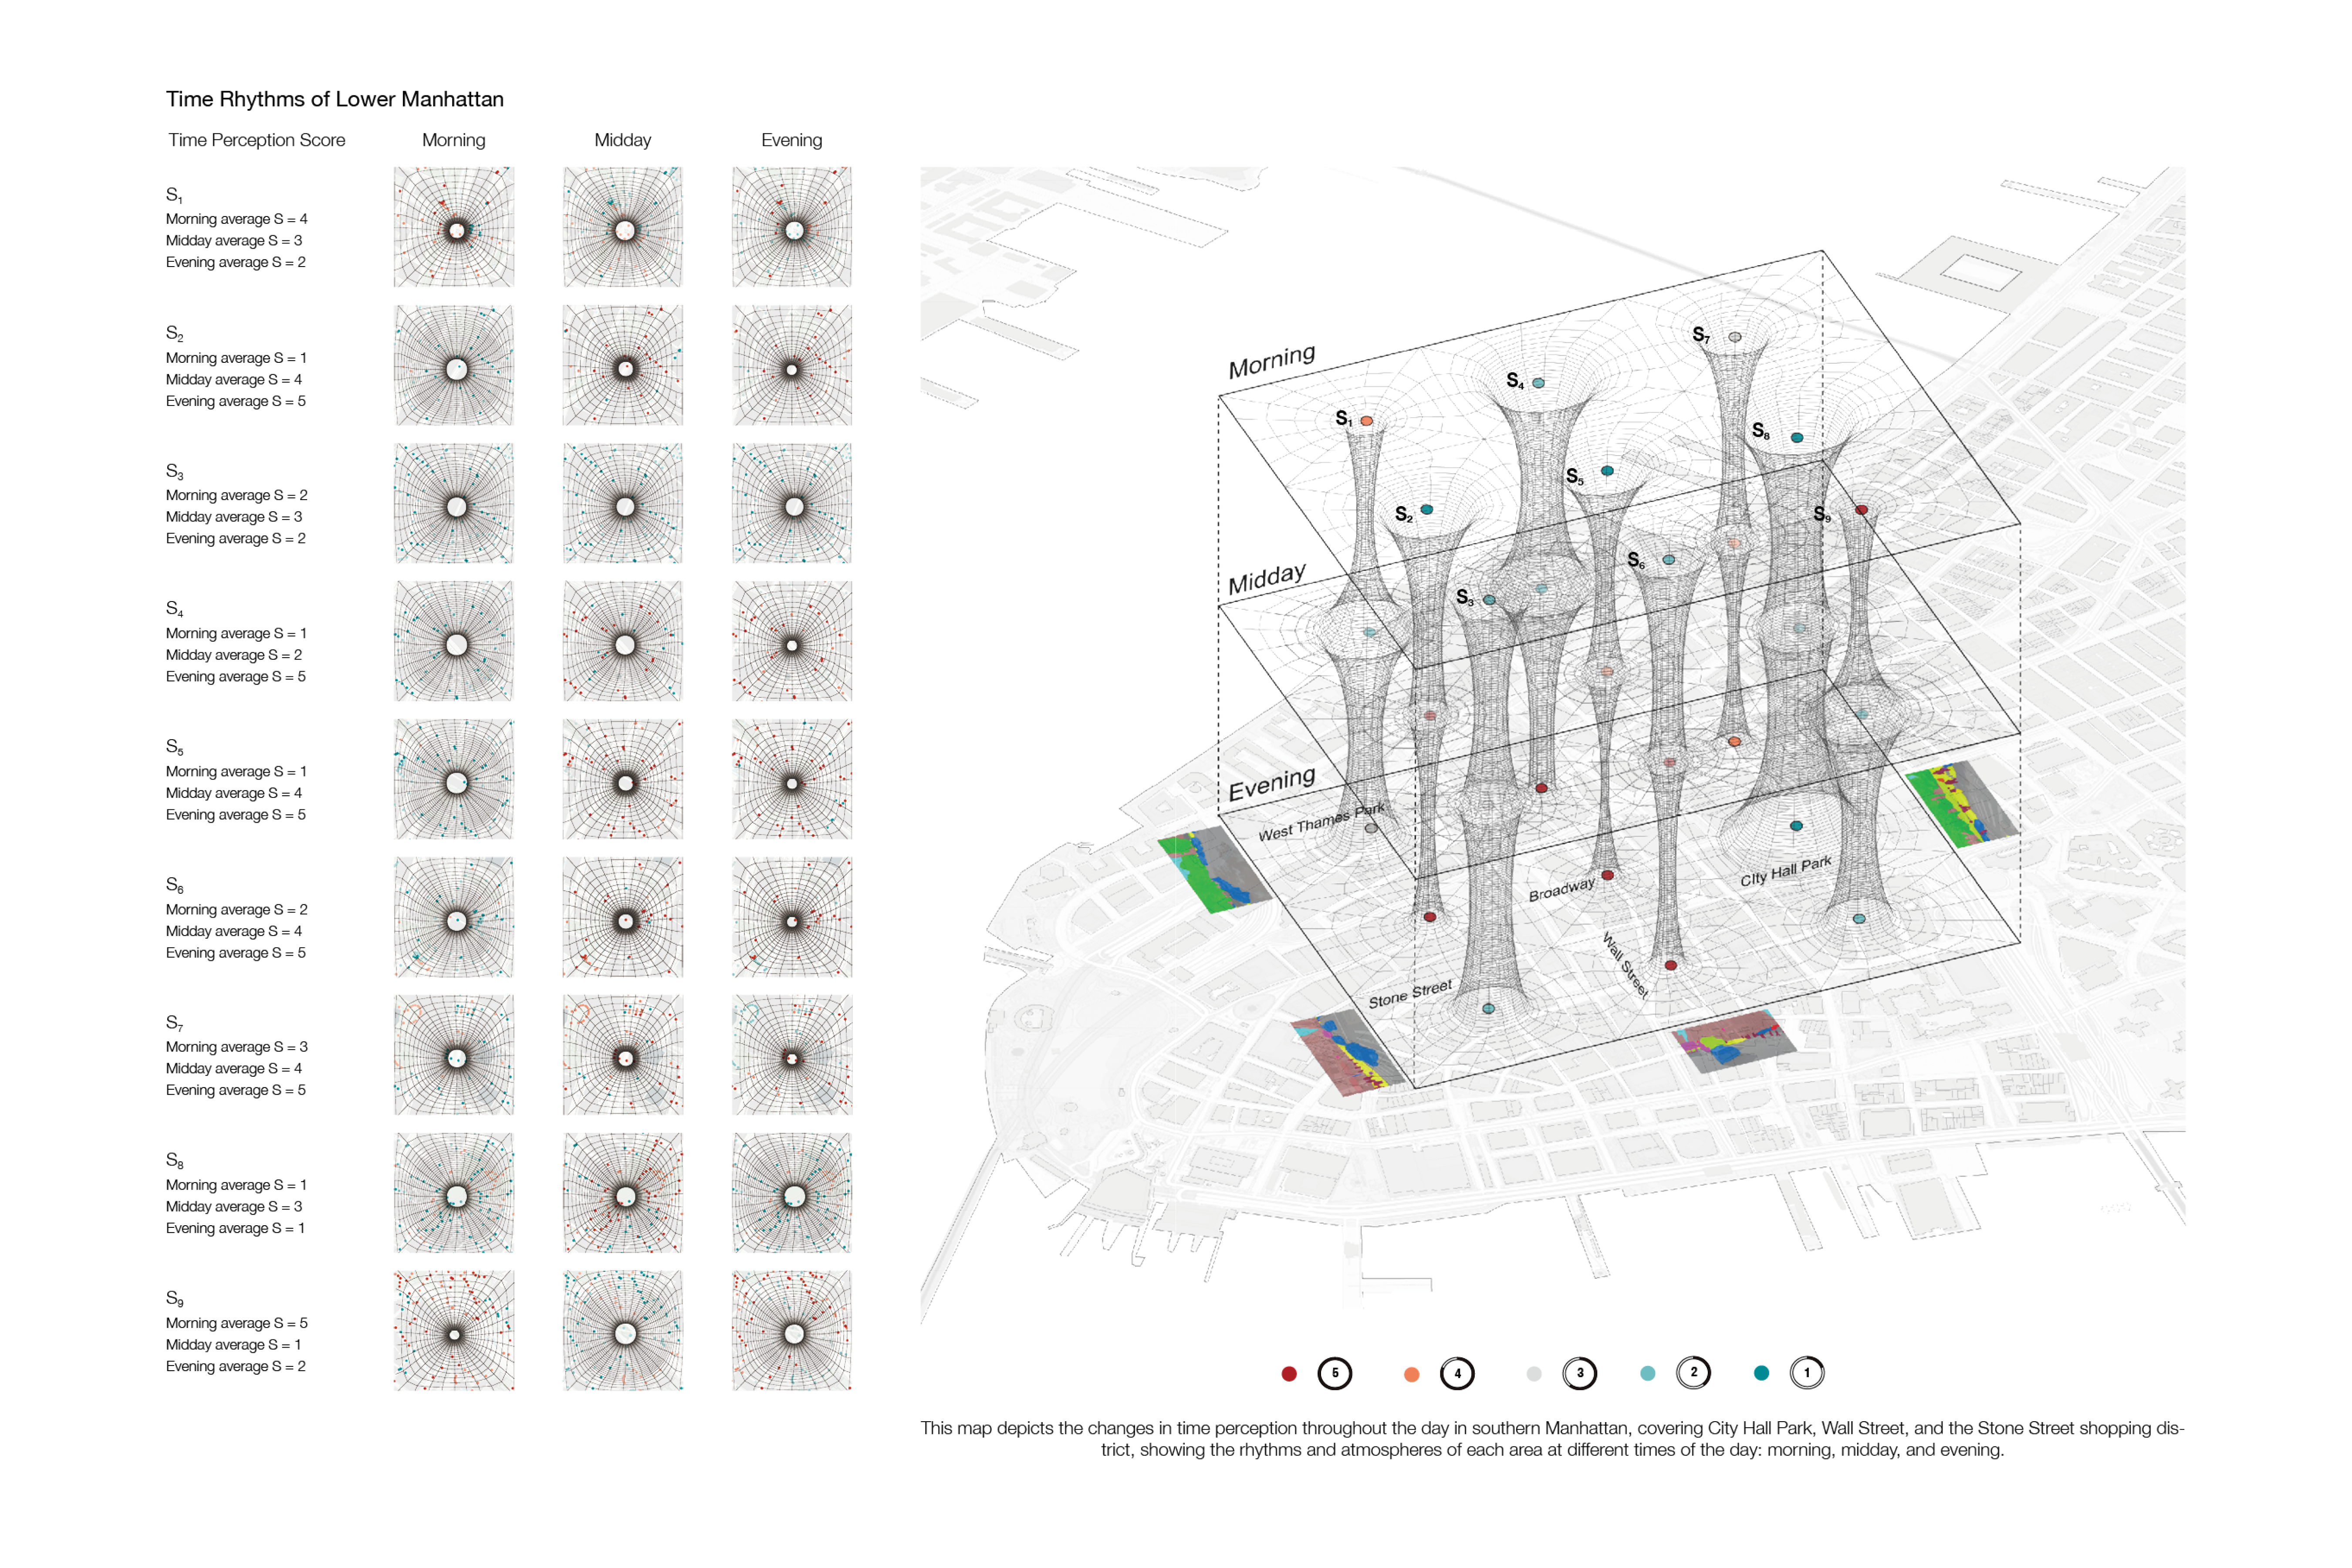
A closer view of Lower Manhattan brings nine sample locations into a layered visualization. The diagram connects morning, midday, and evening scores around places such as City Hall Park, Wall Street, and Stone Street, making differences across both place and time visible.
08 / Research perspective
Making perceived time visible.
The project connects subjective judgments with computational spatial analysis, offering a way to examine how different parts of the city may be experienced at different perceived speeds.
The maps represent perception scores and model predictions, rather than objective measurements of time or evidence that individual streetscape elements cause a particular experience.